[Next] [Previous] [Top] [Contents] [Index]
NAIC/AO Newsletter, March 1997
From May to August 1971, John Durdin and Yervant Terzian (AJ, 77, 637, 1972) had again keeping the extendible boom (see Newsletter No. 16, June 1995) exercised. This time they employed it to reach declinations up to +42°, well north of the present telescope limit of about +38°, in order to map the continuum emission of the Andromeda Galaxy (M31) at 73.8, 111.5, and 196.5 MHz. For the highest of these frequencies, a resolution of 35 arcmin was achieved.
The images produced were of the highest quality, demonstrating the low
levels of radio-frequency interference (RFI) even at meter wavelengths in
those halcyon days. Overlaying their 196.5-MHz contours on the Palomar Sky
Survey blue plate of the galaxy (Fig. 2), they demonstrated the wider extent
of the radio emission when compared with the optical size of M31. Combining
their three-frequency flux densities with other contemporary values, they
concluded that the integrated radio spectrum might well flatten below 200
MHz, although a straight line fit of spectral index 0.6 ![]() was also possible.
They also believed that they had detected a smooth extended halo with a
somewhat steeper spectrum than the radio emission coinciding with the optical
galaxy. Interestingly, that year also found Yervant and Vern Pankonin studying
the extended radio emission of another galaxy in the local group, M33, this
time at 318 and 606 MHz (ApJ, 174, 293, 1972).
was also possible.
They also believed that they had detected a smooth extended halo with a
somewhat steeper spectrum than the radio emission coinciding with the optical
galaxy. Interestingly, that year also found Yervant and Vern Pankonin studying
the extended radio emission of another galaxy in the local group, M33, this
time at 318 and 606 MHz (ApJ, 174, 293, 1972).
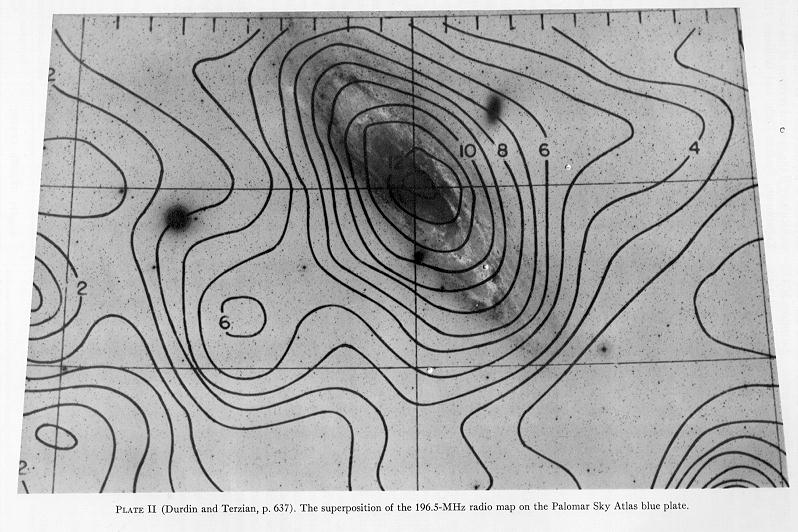
Figure 2. Contours at 196.5 MHz superposed on the Palomar
Sky Survey blue plate (Durdin & Terzian, 1972).
In the world of pulsars, Tim Hankins (ApJ Lett, 181, L49, 1973) used coherent dedispersion to study the fine structure of both the average pulse profile and single pulses from PSR B1919+21 at 73.8, 111.5, and 318 MHz. Achieving time resolutions never before approached at these low frequencies for this pulsar, Tim found a pair of "notches" in the average 73.8 and 111.5 MHz pulse profiles (Fig. 3). Remarkably, these notches were not seen in the 318-MHz profile. For single pulses at the lower two frequencies, the "marching subpulses" were seen to null when their phases within the profile equaled those of the notches (Fig. 4). Tim suggested that this was compatible with the pulsar emission mechanism being distinct from that which forms the average pulse profile, which he suggested could be related to the configuration of the open magnetic field lines in the polar regions of a dipole field.
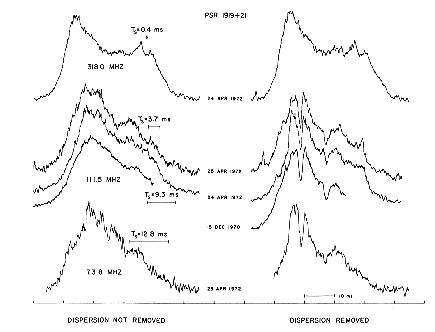
Figure 3. Average pulse profiles for PSR B1919+21 before and
after dedispersion. The time Ts for a dispersed pulse component to sweep
across the receiver bandwidth is shown. The "notches" are seen
in the dedispersed pulses on the right (Hankins, 1973).
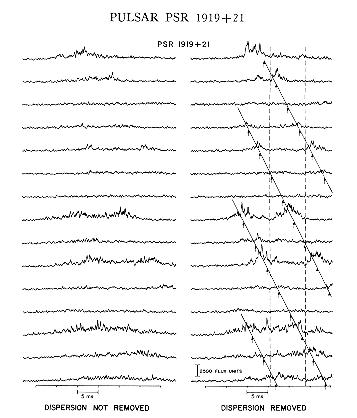
Figure 4. Several consecutive pulse periods of PSR B1919+21
before and after dedispersion. The diagonal lines and arrows indicate the
drift and expected position of marching subpulses. The profile phases of
the "notches" are shown by vertical lines (Hankins, 1973).
Planetary radio astronomy was represented by Jim Condon, Dave Jauncey and Mike Yerbury (ApJ, 183, 1075, 1973) who used continuum observations at 430 MHz to determine the blackbody disk temperature (Td) of Venus. This was of especial interest as earlier determinations of Td at wavelengths longer than 21 cm had found lower values than suggested by extrapolation from centimeter wavelengths.
In order to "defeat" the confusion due to other celestial emitters, Jim and Co. made sets of drift scans on the (moving) position of Venus, repeating these drifts several days later, by which time the planet had moved far away from the observed positions. The drift pairs were then subtracted, effectively eliminating the source confusion from the Venus observations (Fig. 5). Turning the derived flux densities into disk temperatures, they obtained a weighted mean estimate of Td = 523 ± 28 K. This value did indeed confirm the suspected deficit of emission from the planet at decimetric wavelengths, as is demonstrated by a later compilation of such estimates (Fig. 6). Jim and collaborators suggested that the deficit could be due to an anomalously high dielectric constant at latitudes greater than the ±15deg seen by contemporary radar reflectivity measurements, or a drastic upward revision of the decimetric flux-density scale (which we now know is not the case).
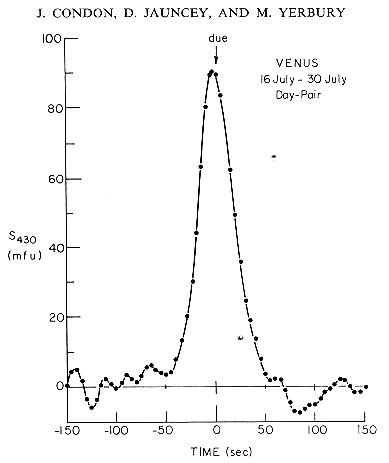
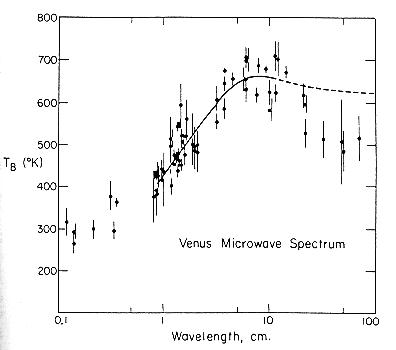
Figure 5. Drift scans across (a) the position of Venus on
1972 July 16; (b) across the same piece of sky 14 days later, and (bottom
panel) the difference between the two (Condon, Jauncey, & Yerbury, 1973).
[Next] [Previous] [Top] [Contents] [Index]