Astronomy Highlights
Table of Contents
- Latest Science Highlights from the Arecibo 12-m Radio Telescope
- Imaging the Brightness Temperature of the Sun at Chromospheric Regions
- Detection of a Bright Burst from FRB 20220912A at 2.3 GHz with the Arecibo 12-m Telescope
- Probing the Plasma Tail of Interstellar Comet 2I/Borisov
- Regular Solar Radio Imaging at Arecibo: Space Weather Perspective of Evolution of Active Regions
- Intense Flare of the current Solar Cycle and Its Coronal Mass Ejection between the Sun and Earth
- Latitudinal Distribution of Sun’s Brightness Temperature
- Pulsar monitoring with 12m telescope
- Continuum imaging of Cygnus X region with the 12m telescope
- 12m telescope for AGN continuum flux density variability measurements
- System stability study for spectral line observations with the 12m telescope
- The "Reverse" Radio Burst Observed by AO Callisto Radio Spectrometer
- A Search for OH 18-cm Emission from Intermediate-Velocity Gas at High Galactic Latitudes
Astronomy at AO
D. Anish Roshi, for RA group
The Radio Astronomy Group consists of 3 scientists (D. Anish Roshi, P. K. Manoharan & B. B. P. Perera), 2 post-doctoral fellows (Allison Smith & Sravani Vaddi) and one Observations Associate (A. McGilvray). The research areas of the astronomy group cover spectral line astronomy, pulsar studies, heliospheric studies and VLBI studies of Dual Active Galactic Nuclei.
Science Highlights
The team at AO made excellent contributions to the field of astronomy using the 12-m dish, including the new wide-band cryogenic front end receiver and the Callisto system.
Latest Science Highlights from the Arecibo 12-m Radio Telescope
Contributed by P K Manoharan
Imaging the Brightness Temperature of the Sun at Chromospheric Regions:
Mapping of the Sun at X-band (8.1 – 9.3 GHz) with the 12-m radio telescope at the Arecibo Observatory allows monitoring of the evolution of the brightness temperature of the quiet Sun and active regions in association with the development of magnetic complexity in the chromospheric regions, which can lead to strong eruptions. A regular monitoring of the solar emission was initiated at the Arecibo Observatory, starting from mid-December 2021. In a day typically 5 to 10 scans are made and each scan provides seven simultaneous images of the Sun, in the frequency band of 8.1 – 9.3 GHz, at an interval of ~170 MHz. These images are useful to address the key issue of difficulty in predicting the occurrence time and location of strong solar eruptions. AO images have the ability to identify and predict active regions producing susceptible to intense space weather events (Earth-directed intense solar flares and energetic coronal mass ejections). Additionally these observations have been extremely useful in understanding the particle acceleration and the radio signatures of coronal mass ejections in the chromospheric regions. Figure 1 displays an animated sequence of images observed at 8647 MHz in the month of February 2023. Each radio image has been compared with the near-simultaneous EUV image of the Sun at 19.3 nm from the Atmospheric Imaging Assembly (AIA) and the solar magnetogram recorded by the Helioseismic Magnetic Imager (HMI) on board the Solar Dynamics Observatory (SDO).
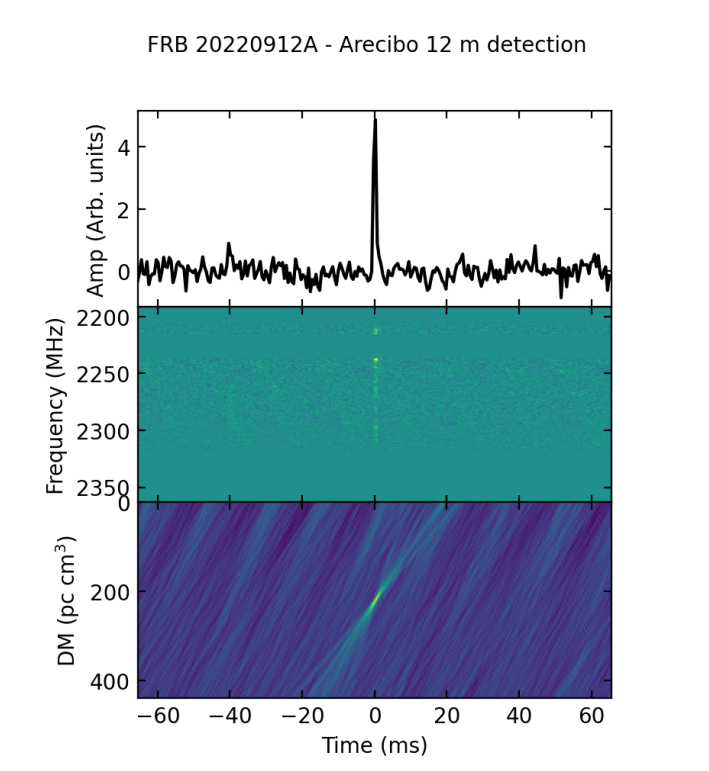
Detection of a Bright Burst from FRB 20220912A at 2.3 GHz with the Arecibo 12-m Telescope (Ben Perera et al. 2022, 2023; ATel #15734 and ATel#16196)
A bright radio burst from the repeater Fast Radio Burst FRB 20220912A was detected with the 12-m telescope at the Arecibo Observatory in Puerto Rico (see Fig. 1). The observation was carried out at 2.3 GHz with a bandwidth of 172 MHz and a sampling time of 128 us. The coordinates used for the observation were RA (J2000) = 23h09m05.49s, Dec (J2000) = +48d42m25.6s, according to the localization constrained by DSA-110 (ATel#15716). The bright burst was detected on 2022-10-27 at 21:38:55.75 UTC with a signal-to-noise ratio of 22. The dispersion measure of the burst was 220.094 pc cm-3 , and the pulse width was ~0.83 ms, leading to a fluence of ~5.8 Jy ms. Combining with other data sets, the 2.3 GHz detection provides vital information about its spectral properties and emission characteristics.
Continued observations of the FRB were obtained with the AO 12-m, and the Green Bank Telescope over the following months as reported in ATel#16196. Differences in the number of burst detections between the telescopes suggest that FRB20220912A possesses a steep spectrum. More work is underway to understand these bursts.
Probing the Plasma Tail of Interstellar Comet 2I/Borisov (P. K. Manoharan et al. 2022, PSJ, 3, 266)
The high sensitivity observations with the Arecibo 305-m radio telescope revealed fine-scale structures in the plasma tail of “Interstellar Comet Borisov”. Comet Borisov was only the second interstellar object known to have entered the solar system. Polarimetric observations of Borisov suggested a remarkably smooth, pristine coma with a high concentration of carbon monoxide, that had likely never interacted with the solar wind of either the Sun or any other star. The comet could have formed around a red dwarf – a smaller, fainter type of star than the Sun – though other kinds of stars are possible. At the Arecibo and Green Bank Observatories, we took advantage of the passage of the plasma tail of Borisov in front of a number of compact extragalactic radio sources to investigate the properties of its plasma tail using radio scintillation observations, at P-band (302–352 MHz), 820 MHz, and L-band (1120–1730 MHz; see Fig. 2). These observations were unique in determining the dimensions of the plasma tail of Borisov when it was ∼2 AU away from the Earth, assessing the level of its density fluctuations, and deriving the spectrum of its density turbulence, as well as the associated density scale sizes existing across the tail from the edge to the central axis. The discovery of a high-frequency spectral excess corresponding to irregularity scales much smaller than the Fresnel scale suggests the presence of small-scale density structures near the axis of the plasma tail, less than or about 10 km, likely caused by interaction between the solar wind and the plasma environment formed by the comet. Arecibo observations reveal the density enhancement in the plasma tail to be in the range of ∼15 – 20 times higher than that from the background solar wind.
Regular Solar Radio Imaging at Arecibo: Space Weather Perspective of Evolution of Active Regions (P K Manoharan)
Mapping of the Sun at X-band (8.1 – 9.3 GHz) with the 12-m radio telescope at the Arecibo Observatory allows monitoring of the evolution of the brightness temperature of active regions in association with the development of magnetic complexity, which can lead to strong eruptions. A regular monitoring of the solar emission has been initiated at the Arecibo Observatory and has been carried out for about a year. These observations are useful to address the key issue of difficulty in predicting the occurrence time and location of strong solar eruptions. AO images have the ability to identify and predict active regions producing susceptible intense space weather events (Earth-directed intense solar flares and energetic coronal mass ejections; see Figs. 3 and 4). Additionally these observations have shown extremely useful in understanding the particle acceleration and the radio signatures of coronal mass ejections in the chromospheric regions.
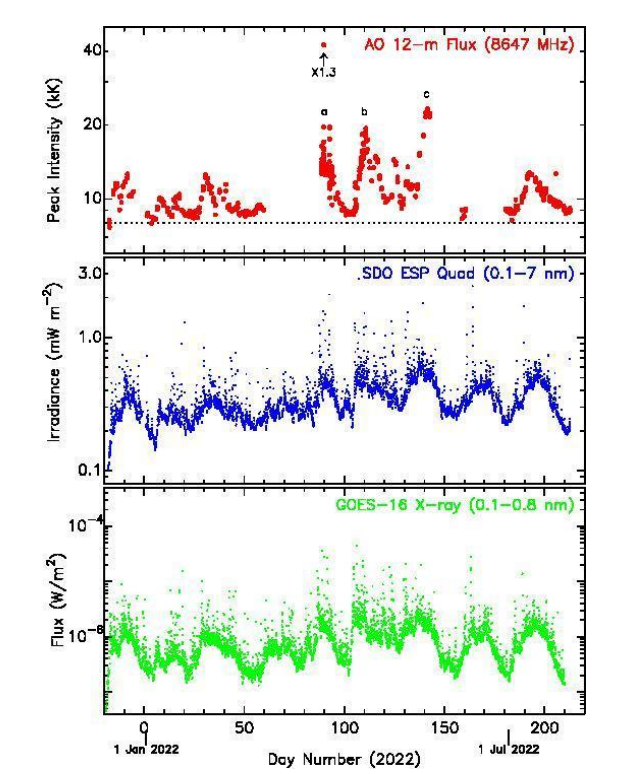
Intense Flare of the current Solar Cycle and Its Coronal Mass Ejection between the Sun and Earth (Alexander O. Molina Ortiz and P K Manoharan, the REU student’s project presented at the AGU 2022)
Coronal mass ejection (CME) events are important in terms of their impacts at the magnetosphere of the Earth, developing into geomagnetic storms. We report the study of a fast CME event that occurred in the minimum phase of the current solar cycle. The CME was associated with an intense X 1.3 solar flare on 30 March 2022 (see Fig. 4), which occurred at the active region #12975. At the time of the flare, the active region developed into a complex magnetic configuration of Beta-Gamma or Beta-Gamma-Delta classification (see Fig. 4 from the 12-radio telescope). The flare manifestations have been analyzed using the EUV images from the Solar Dynamics Observatory (SDO) at a range of wavelengths. The AO Callisto radio spectrometer recorded the shock associated with the CME in the low coronal region (see Fig. 5). We estimate the initial speed of the CME, ~920 km/s within the field of view of 30 solar radii, using the white-light images observed with the LASCO C2 and C3 coronagraphs on board Solar and Heliospheric Observatory (SOHO) spacecraft. The arrival of the CME at near-Earth space and the signatures of the associated shock have been analyzed using the NASA OMNI solar wind database.

Latitudinal Distribution of Sun’s Brightness Temperature (PK Manahoran)
The regular solar X-band mapping at the AO covers a period of more than 15 months starting from 13 December 2012 (just after the minimum phase of the current solar cycle #25). These observations have provided more than 1500 images, which are essentially useful to study the development of the solar activity in the ascending phase of the current solar cycle. For example, in each map, the central meridian cut of about half the size of the telescope beam width is taken (i.e., this portion of the map covers the center of the Sun’s disk between the south pole and the north pole) and the “Latitude-Time” plot of the brightness temperature is constructed as shown in Figure 2. This plot covers between 13 December 2021 and 30 March 2023. For reference, the sunspot number and the strength of the smoothed polar magnetic field are also included in the bottom plot. In a broad sense, the “Latitude - Time” plot resembles the “sunspot butterfly” diagram and reveals the changes of the major large-scale magnetic and brightness structures and the development of activities occurred in the ascending phase of the solar cycle #25. In spite of several observational gaps, the brightness distribution shows several interesting features.
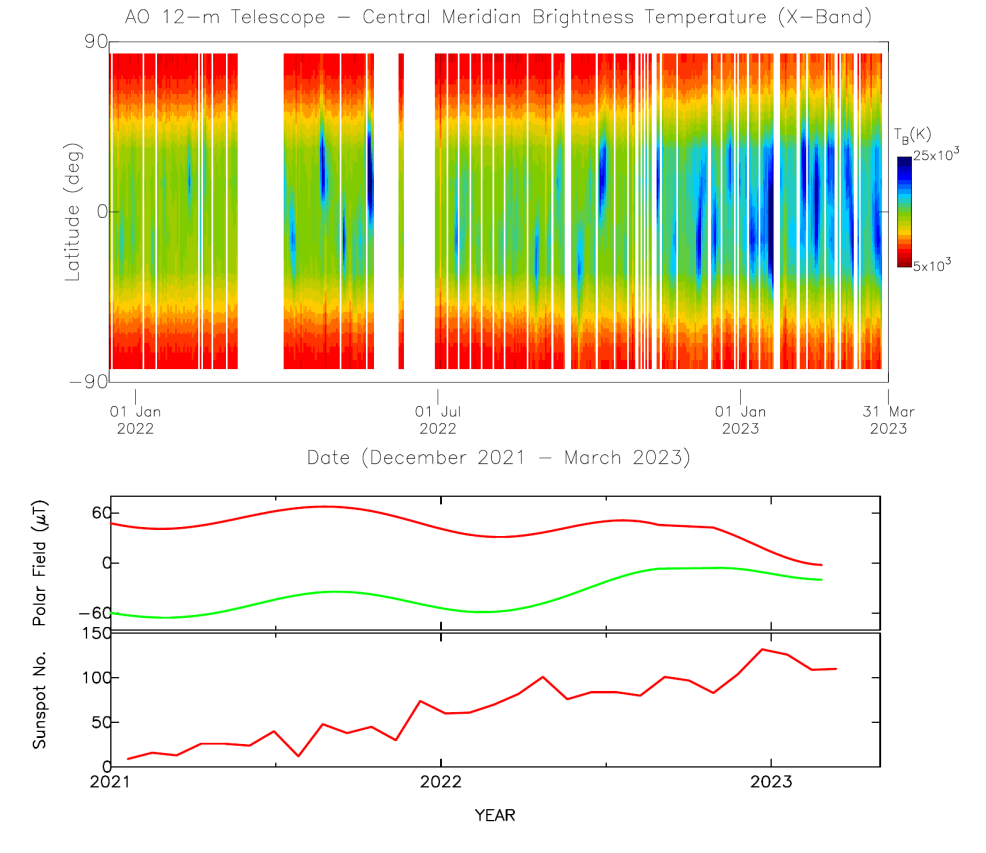
In the above plot, the central meridian crossing of an active region is associated with the enhanced brightness temperature. The development of the solar activity is clearly indicated by the gradual increase in the latitudinal width of the brightness distribution as the sunspot number increases between mid-December 2021 to March 2023. Moreover the high brightness temperature associated with the crossing of well-developed active regions is seen as enhanced brightness temperature patches and a value of 13,000 K and above serves to identify active regions of ∼ strong eruptions at the disk center of the Sun leading to Earth-directed coronal mass ejections. Additionally, the high-latitude coronal holes (i.e., open magnetic field regions of low-density) are always associated with the low-emission brightness temperature. The increase in the number of active regions in association with the sunspot count is shown by the number of bright emitting regions. Moreover, as the solar activity increases, the disappearance of the coronal holes in the polar regions are evidently shown by the shrinking of the low-emitting regions towards the poles. This result is consistent with the gradual disappearance of polar coronal holes and the decrease in polar field strength at latitudes greater than 60 degrees at the north and south poles (Figure 2, middle plot). The marginal north-south asymmetry, i.e., the faster rate of disappearance of the northern coronal hole than of the south pole region is evident in the brightness distribution and it is consistent with the strength of the polar fields. The presence of mid and low-latitude coronal holes at the central meridian of the Sun, shown by X-ray and EUV images of the Sun, is also observed as vertical low-emitting strips on the latitudinal distribution.

The above results of brightness temperature distribution observed with the 12-m telescope are also consistent with the latitudinal distribution of Thomson-scattered brightness observed by the LASCO-C2 coronagraph on board Solar and Heliospheric Observatory spacecraft. Figure 3 shows the “latitude - year” image of the white light, which is associated with the density of free electrons, measured at 4 R⊙ above the east limb of the Sun by the LASCO-C2 coronagraph and the period covered is same as that of X-band plot shown in Figure 2. The gradual increase in the width of high density features, associateed with close-field active regions, is consistent with the distribution of X-band brightness temperature. Moreover, the decrease in the width of the lowdensity coronal hole regions at the poles is remarkably consistent with the brightness temperature distribution. Another remarkable feature seen in the LASCO plot is the low-density vertical patch near the south pole centered around 10 April 2022. It was associated with a large coronal hole located at the south pole of the Sun and extended from the pole to a latitude of about 50 degree. The LASCO-C2 observed the low-density feature at the east limb of the Sun. As the coronal hole rotated to the center of the Sun in about 7 days, it was recorded by the 12-m telescope around 17 April 2022.
Pulsar monitoring with 12m telescope (Ben Perera)
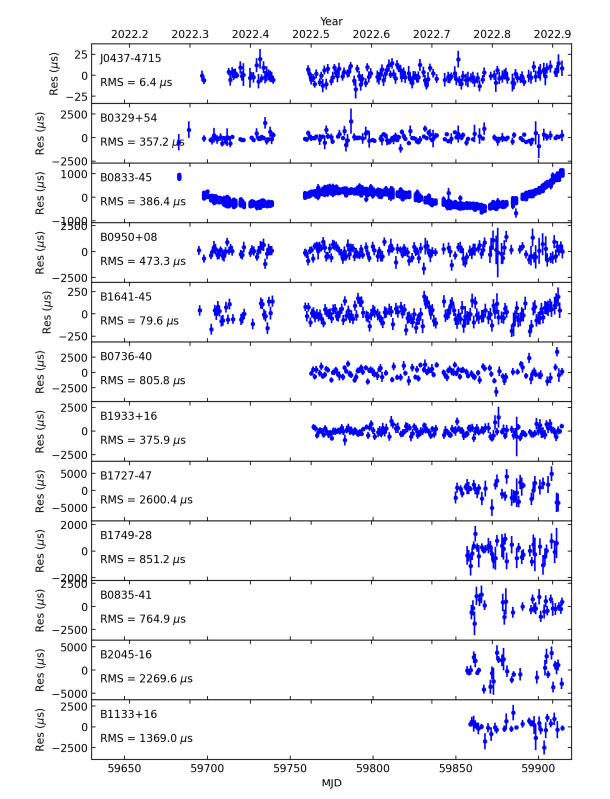
The high-cadence pulsar monitoring program with the 12m telescope started in April 2022 and is currently being used to observe dozen pulsars daily at 2.3 GHz. It is crucial to carry out high-cadence pulsar monitoring to investigate their short- and long-term rotational stability and emission variability, leading to understanding the pulsar emission mechanism in general. Pulsars are excellent tools to study fundamental physics such as low-frequency gravitational waves and thus, understanding their emission physics is highly important. It is known that some of our pulsars in the daily sample exhibit different rotational behaviors such as glitches, and some exhibit emission variabilities such as mode changing, drifting sub-pulses, etc. Therefore, our data set is highly valuable. We have built a pipeline to process and clean our data daily after the observing session and produce science-ready data products. These daily observations are used to obtain their timing residuals shown in Fig. 6. Our aim is to observe these pulsars with high cadence for a long-term period, while including more pulsars in the daily sample. We will eventually integrate these data with the high-sensitive data that will be collected daily when the cryogenic receiver system becomes available. In addition to the daily monitoring, simultaneous observations of a set of our pulsars are made with the AO 12-m (at 2.3 GHz), GBO 20-m (at 1.4 GHz), CHIME (at 600 MHz), and LOFAR German station (at 150 MHz) to study their emission properties at multiple frequencies, including the single pulses. The regular emission of the Crab pulsar cannot be detected with the 12-m telescope. However, its giant pulses can be detected. Therefore, we initiated simultaneous observations of the Crab pulsar with the AO 12-m and GBO 20-m telescopes to study the frequency-dependent properties of its giant pulses. A set of simultaneous giant pulses from the Crab pulsar has been extracted from these observations.
The repeater FRB 20220912A and the Galactic SGR J1935+2154 became active in October 2022. We included both sources in the daily pulsar monitoring program and started monitoring at S-band. We detected a bright burst from the FRB 20220912A (see Fig. 1; Ben Perera et al. 2022, ATel #15734). We also then initiated a simultaneous monitoring campaign on both sources with the AO 12-m (at S-band) and GBO 20-m (at L-band) telescopes.
The upgraded 12-m telescope with the cryogenic receiver will have the sensitivity to monitor more than 100 pulsars greater than a signal-to-noise of 10 within 10 minutes of observations. We plan to include all these pulsars in the current high-cadence monitoring program and collect data with the full Stokes mode, allowing us to study their polarization properties. The current low-sensitive data of the pulsars in Fig. 6 collected with the room temperature receiver will be combined with the new data to extend their timing baseline. In addition to pulsars, we plan to use the upgraded 12-m telescope as a dedicated instrument in FRB searching and monitoring repeaters at high-frequencies. The new system will have the sensitivity to detect more than 50 known FRBs, indicating that it is a good instrument to regularly search for and monitor (repeating) FRBs. The magnetars generally have flat spectra. We plan to monitor a set of magnetars regularly with the upgraded 12-m telescope to detect their active phases and study their emission physics and rotational variations.
Continuum imaging of Cygnus X region with the 12m telescope (D. Anish Roshi)
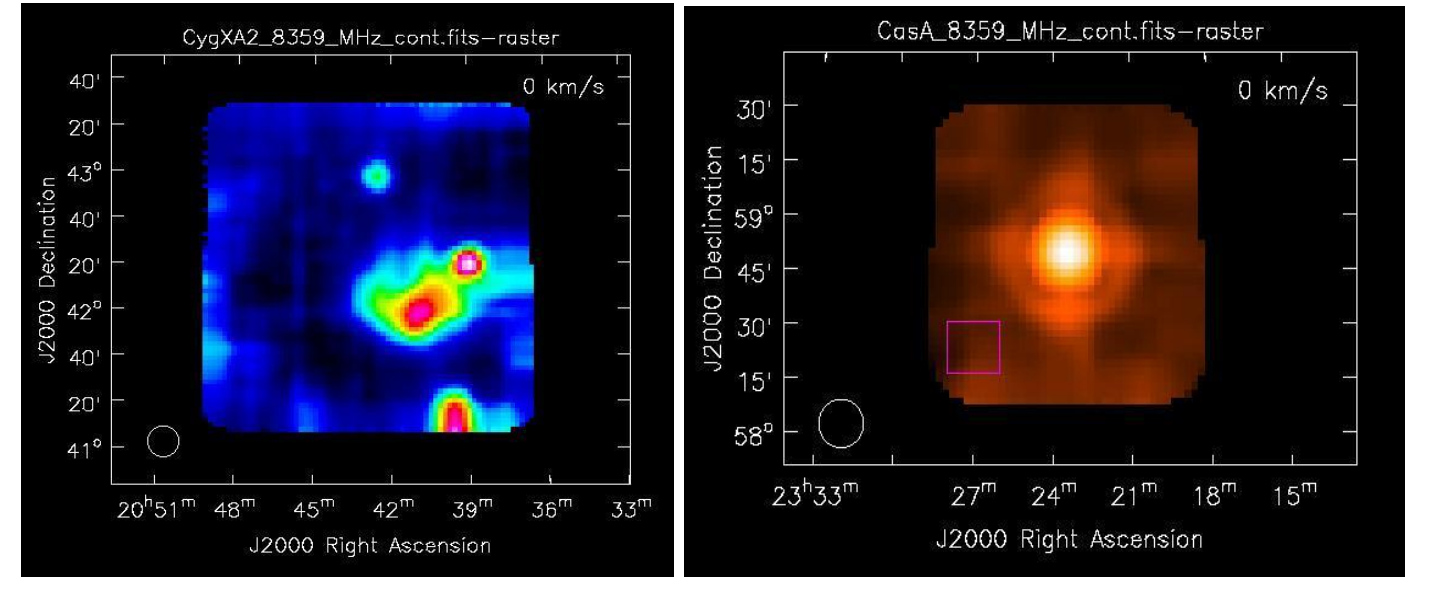
A continuum image of a 6deg X 6deg region centered at G80.0+1.4 (Cygnus X region) is being made with the 12m telescope. The observations were made at 8.5 GHz with a bandwidth of ~ 1GHz. The continuum data set complements the data obtained from a recombination line survey of the same region made with the Green Bank Telescope at 330 MHz and 800 MHz. The properties of the diffuse ionized gas responsible for continuum and spectral line emissions can be well constrained using this rich data set. We observed 16 overlapping regions, each of size 2deg x 2deg, with the 12m telescope. The data processing is in progress. Preliminary image of a 2deg x 2deg region and the image of the calibrator source (Cas A) are shown in Fig 7.
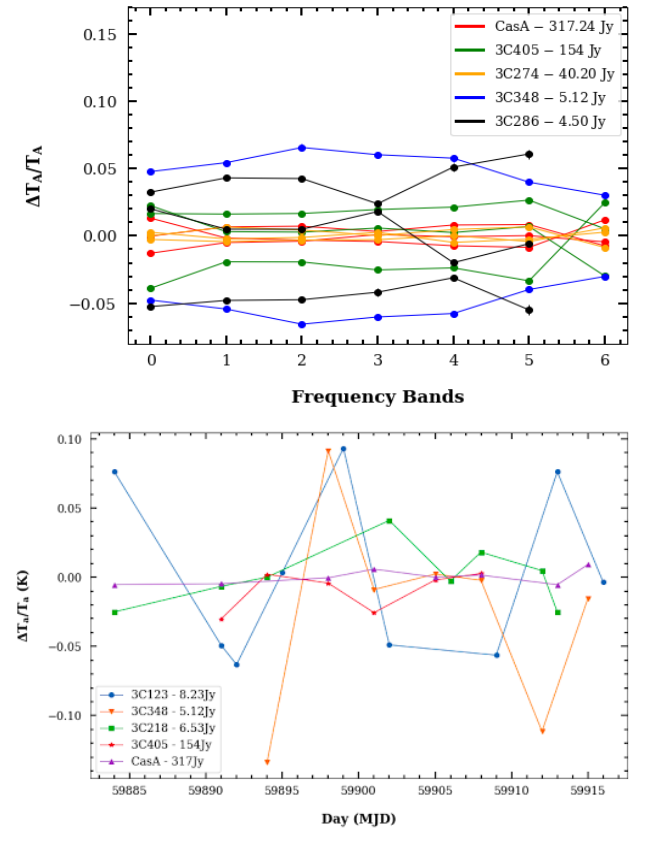
12m telescope for AGN continuum flux density variability measurements - feasibility study (Sravani Vaddi)
Test observations to study the feasibility of monitoring the flux density variability of AGNs were made with the 12m telescope. Five continuum flux density calibrators were observed at a cadence of once a week for about three to four weeks in August 2022 and October 2022 in order to determine the systematics affecting the flux density measurements. The August 2022 observations were done by taking ‘cross scans’ on each source while the October 2022 observations made use of a new ‘on-off’ mode with noise switching. The frequency range 8.1 to 9.1 GHz were used for observations, which was covered using 7 Mock spectrometers (i.e the 7 frequency bands in Fig. 8 top). The results of the data analysis are shown in Fig 8. We measured about 10% fractional change in antenna temperature for a 4.5 Jy source over a month using ‘cross scan’ observations. We found that the fractional variation is larger (about 15% for an 8.2 Jy source) when using the ‘on-off’ mode of observations (see Fig. 8 bottom). The measured variations are dominated by systematics; the measurement errors are close to the size of the dots in the plot. Investigations to reduce the systematic variations in measured flux density are underway.
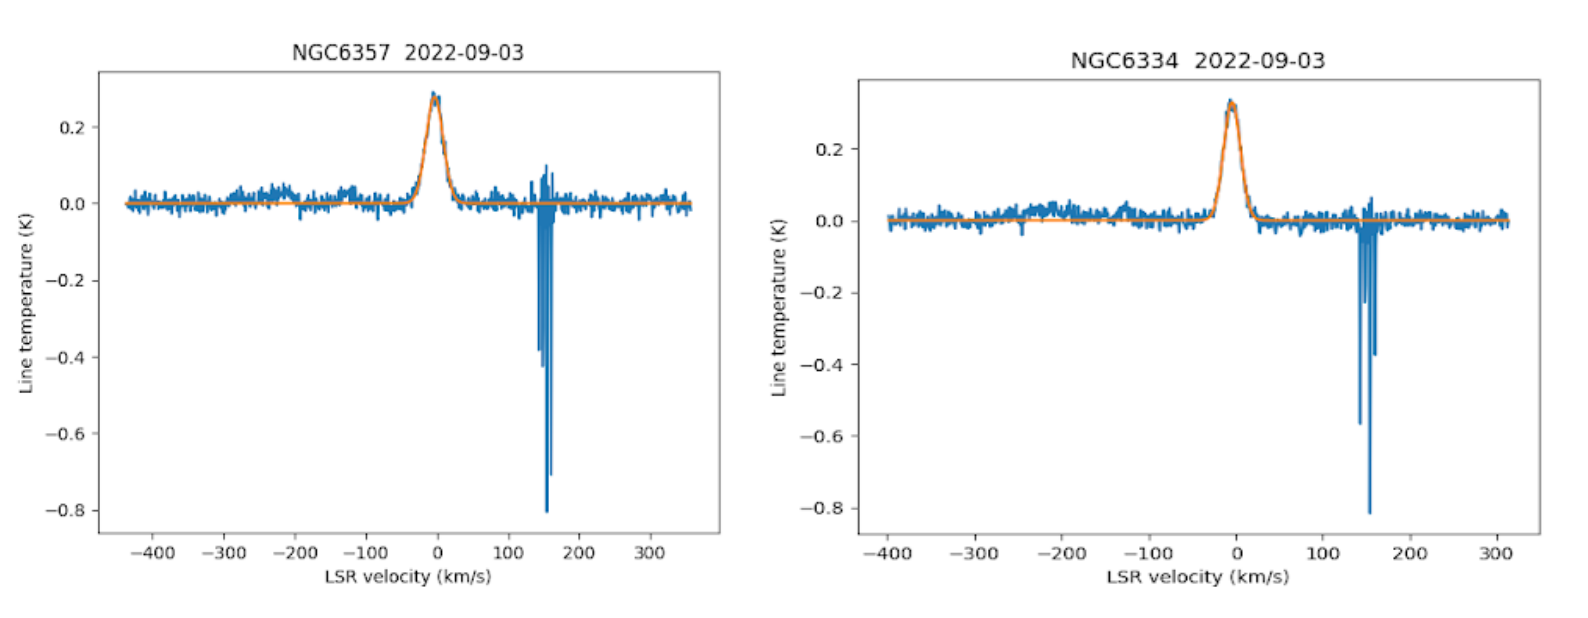
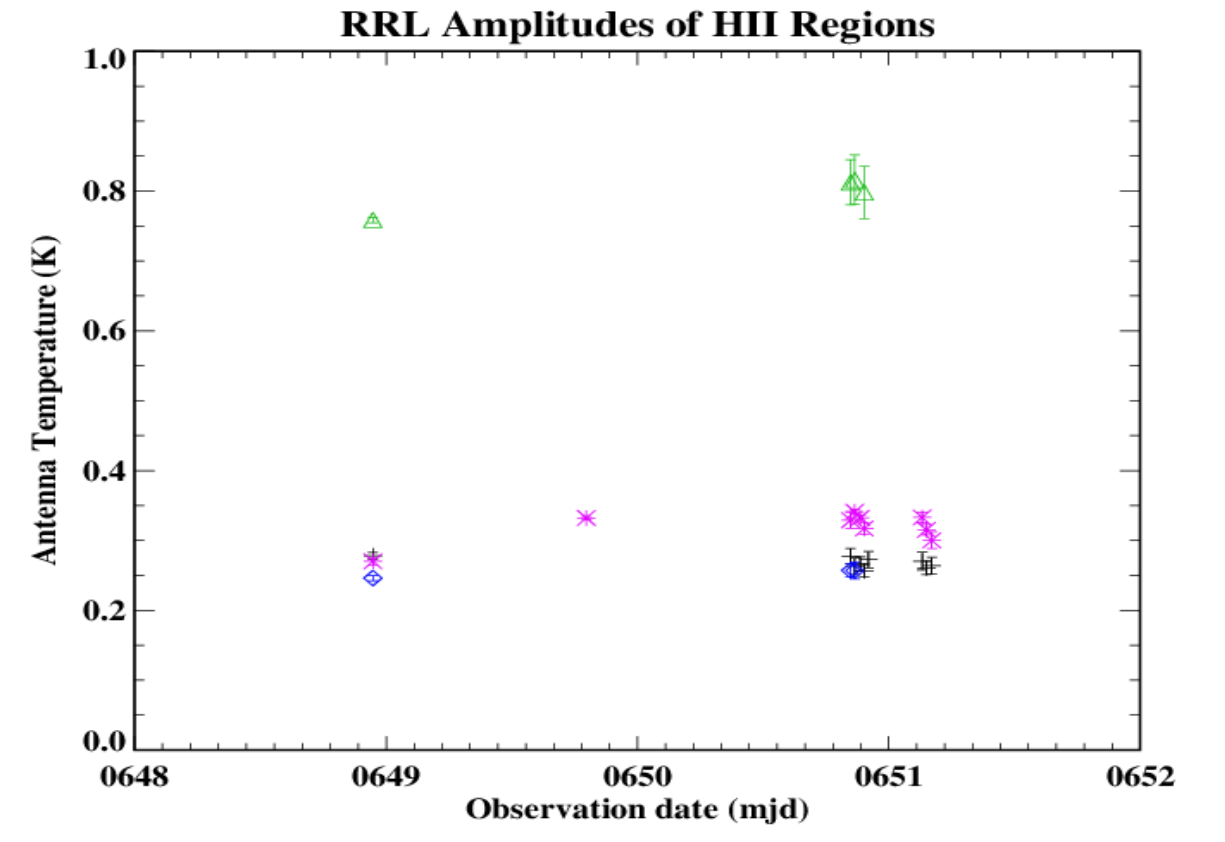
System stability study for spectral line observations with the 12m telescope (Allison Smith)
The 12m telescope is being used to periodically observe radio recombination lines (RRLs) toward a set of HII regions. The motivation to do these observations is to check the stability of the system for spectroscopic observations. These observations also form a training program for the post-doctoral fellow to build experience on, for example, commissioning a telescope. RRL spectra toward two sources obtained as part of this program at X-band (8.5 GHz) are shown in Fig 9. The line antenna temperatures vs observing day for different sources are shown in Fig 10.
The "Reverse" Radio Burst Observed by AO Callisto Radio Spectrometer (P. K. Manoharan):
We observed several interesting solar radio bursts even in the minimum phase of the current solar cycle. For instance, on 16 July 2022, AO Callisto observed nice “reverse” radio bursts (corresponding to "U" bursts) in association with a coronal mass ejection (CME; see Fig 11). U-bursts and J-bursts are the signatures of electron beams traveling along closed magnetic loops. The “U” shape arises from an electron beam traveling up the ascending leg of a magnetic loop through a decreasing plasma density, corresponding to a negative (reverse) frequency drift rate. The spectrum below shows the Callisto spectrum observed on 16 July 2022 ~18:31 UT. The associated CME was observed by space missions as well as in-situ spacecraft. In the right-hand side of the figure, EUV images of the CME observed by the Solar Dynamic Observatory (SDO) space mission and the STEREO Ahead Spacecraft in the wavelength band of 304 Å are shown. The magnetic loop structure seen in these images corresponds to the path of the “reverse” bursts. When the CME arrived at the Earth on 19 July 2022, it caused a moderate to an intense geo-magnetic storm of Dst level of about -60 nT. Further analysis is performed on the CME initiation, magnetic-loop characteristics and the observed storm. During the past one year of regular monitoring of the AO Callisto, over the Atlantic time zone, has resulted in a large number of interesting radio bursts, which are useful in identifying the magnetic configuration of the eruptive site.

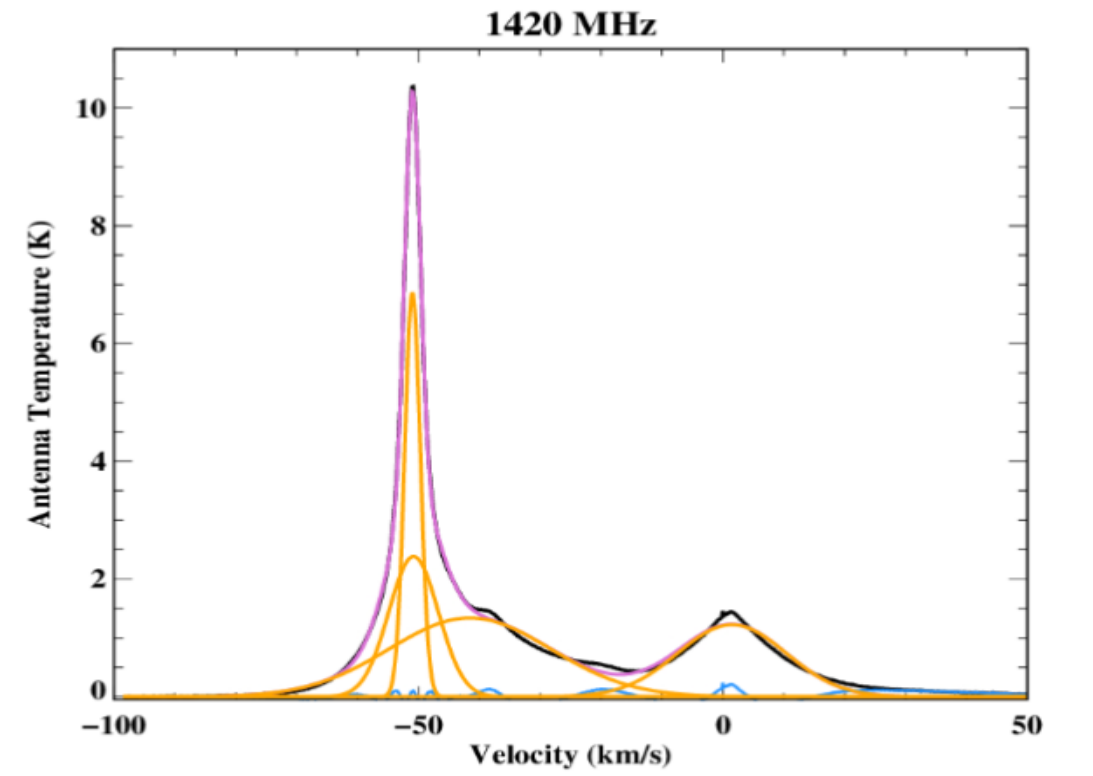
A Search for OH 18-cm Emission from Intermediate-Velocity Gas at High Galactic Latitudes (Allison Smith and Anish Roshi 2022, submitted to ApJ):
This study uses data from the 305-m telescope at the Arecibo Observatory to perform a high sensitivity search for OH 18-cm emission toward 22 intermediate velocity clouds. The targets for this survey were selected from a list of candidate intermediate velocity molecular clouds compiled by Rohser et al. (2016). Detection of such objects is important for understanding the effect of gas infalling toward the galactic plane on the star formation cycle. In addition, observations of these typically non-star forming molecular clouds provide unique opportunities to investigate the underlying physical processes that govern the atomic-molecular transition of gas in our Galaxy. This study presents upper limits on OH toward all of the observed sightlines and performs a detailed investigation of the ISM in these regions by combining the OH data with HI detections in the Arecibo observations (see Fig. 12 for an example HI detection), archival extinction (A𝓿) and HI data, as well as the photodissociation region models of Neufeld and Wolfire (2016). Results from this analysis make important inferences on the physical nature of the IVMCs, including that their structure is likely inhomogeneous, consisting largely of widespread atomic hydrogen with significantly smaller clumps of molecular material throughout. These results also provide guidance for future searches of IVMCs, the detection of which may have critical implications for the interplay between the Milky Way’s star-forming molecular disk and its surrounding reservoir of gas.